Sign up for Prowler Updates
ProwlerPro Dashboards II
Hello again. This is Sergio, one of the engineers of ProwlerPro and Prowler Open Source. In the previous video, we saw all the features of the Home dashboard, such as the Global Security Status per Region, which shows you another status per AWS region, or the Security Posture Evolution panel, which contains an AWS service graph with a history of the past and failed findings over the scans.
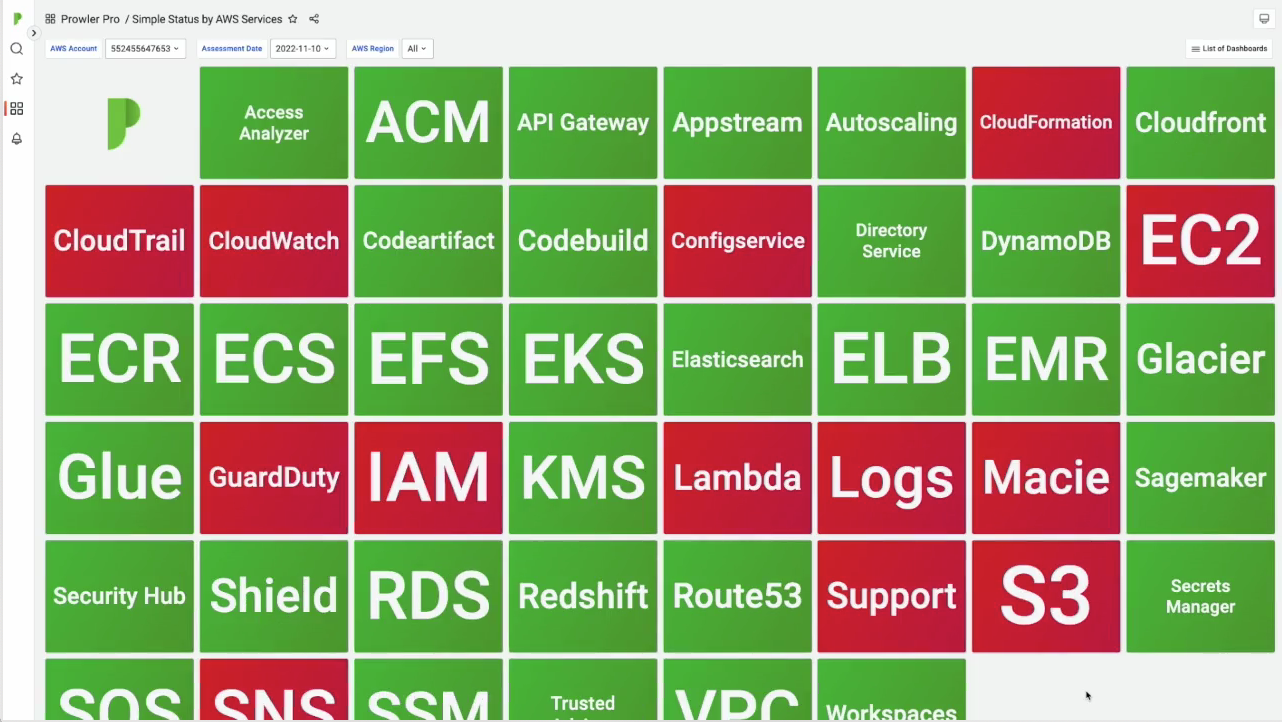
This time we will cover the Simple Status per AWS Service dashboard, which shows you the security status of each AWS service that ProwlerPro scans. So let’s see how can we get to this dashboard in ProwlerPro.
Let’s log in to your ProwlerPro account in prowler.pro. In our case, we are going to log in to our demo account. Okay, so right now we are on the ProwlerPro overview page. To go to the dashboards, we have to click either on the dashboard button or in the results. As we show in the previous video, the very first dashboard that you’ll see is the home dashboard.
To access the rest of the dashboards, you will have to click in the List of Dashboards drop down menu. In this case, I’m selecting the Simplest Status by AWS Services dashboard. As we already mentioned, this dashboard shows the security status per AWS service that ProwlerPro scans. Green indicates that all checks were passed in that service and red indicates that one or more checks in that service failed.
You can also play with the filters in this dashboard. For example, the AWS account filter lets you choose the accounts that you’d like to see the findings of, which is going to be useful when we release the multi-account feature. The assessment date lets you choose the date for which you want to see the services’ status and the AWS region lets you choose all the available AWS regions where you’re going to see the status of the services.
This filter can have one, more, or all regions. As you can see, the filters are applied automatically and the dashboard changes. Remember that all the panels are clickable. You can click in any service and see the details of the failed findings for each of them. For example, let’s click on the EC2 service.
We can see the failed findings that caused the EC2 service panel to be in red. These are four default BBC security groups that allow all types of traffic in four different regions. And for regions that doesn’t have the EBS default encryption activated. You can also play with the filters in this panel, for example, by selecting the severity you want to see.
Moreover, this panel allows you to export the results into a CSV or Excel format, so you can share these failed findings to a member of your team. To do this, click on the table title and select inspect data on the drill down menu that will appear. Now the CSV can be downloaded by clicking on Download CSV. The option download for Excel can be activated for using this CSV in Excel.
And that is all in this video. If you have any questions, please join our Slack group and post it in the Ask-a-Question channel. You can find the link below or at prowler.pro. It was a pleasure having you in this video. See you soon.

Sergio Garcia
Engineer at ProwlerPro
I’m a Cloud Security Engineer with experience in AWS. Among my roles, I completed an internship at Amazon and supported a digital bank to secure its assets in the cloud. I’m passionate about cloud automation, even more if it helps to ease security management.
Recent Articles
CSPM for GCP: Securing Your Google Cloud Environment with Modern Cloud Security Posture Management
Modern organizations rapidly embrace the Google Cloud Platform for its scalability, innovation capabilities, and cost-effectiveness. However, this digital transformation comes with a critical challenge: maintaining robust security across increasingly complex...

Prowler’s State of Cloud Security Report 2025
https://youtu.be/S8nLoxgrc5o Rajiv Taori and Laura Franzese walk through the findings of the 2025 State of Cloud Security Report We've been in this industry long enough to know that survey data...

Prowler Cloud: The Most Affordable, Effortless Way to Scale Cloud Security
Cloud security should be simple, cost-effective, and able to grow with your business. Prowler Cloud delivers all of this and more, offering the industry’s lowest total cost of ownership and an architecture...